
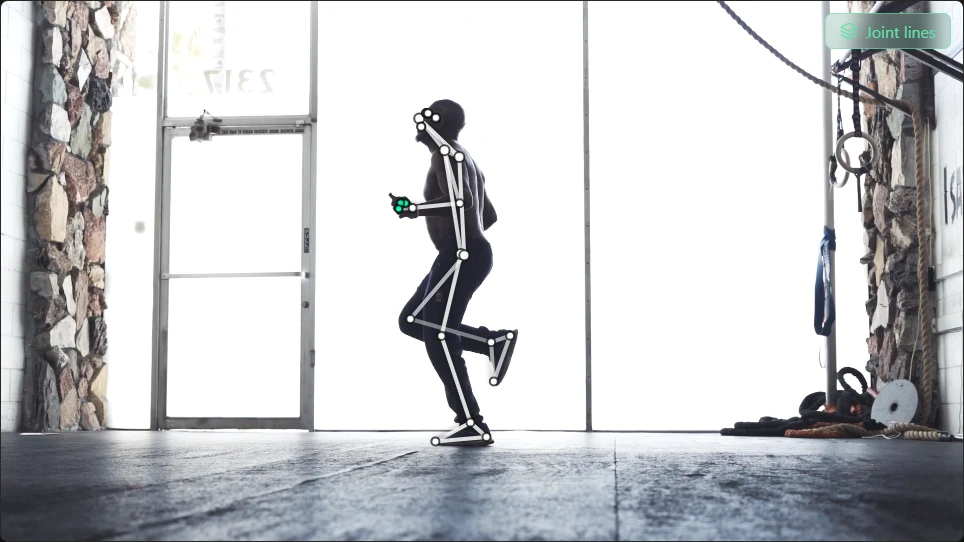
Computer vision starts with an image. Every video frame is a grid of pixels. A pose model examines that grid and predicts likely locations of body landmarks. Those landmarks are useful, but they are not the same thing as directly measured bones, joint centers, or forces. A biomechanics application has to convert predictions into anatomical estimates.
Step 1: Video frames
A video is a sequence of frames. If the subject moves quickly, if the camera shakes, or if a limb leaves the frame, the model has less reliable visual information. This is why students should treat recording quality as part of the experiment.
Step 2: Pose landmarks
MediaPipe Pose Landmarker detects landmarks in normalized image coordinates and also outputs 3D world landmarks. The system can also report visibility, which helps indicate whether a landmark is likely visible in the image. Movision Labs uses these concepts to estimate segment positions, joint centers, and tracking quality.
Step 3: Segmentation masks
A segmentation mask estimates which pixels belong to the person. This helps with visual effects such as blurring the subject, and it can also help the app reason about approximate body scale in the image. It is still an estimate, not a perfect outline.
Step 4: Model fitting and retargeting
Landmarks alone are points. A mesh gives those points anatomical context. Retargeting maps the estimated pose onto a digital model so students can inspect how the body is moving. This is the step that makes the analysis easier to teach because it connects dots and signals to a recognizable body.
Step 5: Biomechanics signals
Once the app has processed the skeletal data, it can calculate movement signals that describe how the pose changes over time. These signals are useful for education and comparison, but they should be interpreted with attention to assumptions, camera view, and model fit.
What students should remember
- Image landmarks are predictions from pixels.
- World landmarks are model estimates, not direct laboratory measurements.
- Visibility and segmentation help judge whether the model had enough information.
- Mesh fitting makes the result interpretable, but it adds modeling assumptions.
- Good conclusions combine the video, the overlay, the plot, and a limitations statement.
Common mistakes in student interpretation
The first mistake is treating a landmark as a direct measurement. A landmark is a model prediction at a visible body location, and it should be interpreted with the original video.
The second mistake is ignoring time. A single frame can be useful, but biomechanics is often about how a variable changes. Students should use the vertical time cursor, compare the plotted signal with the video, and ask what the body was doing when a peak occurred.
The third mistake is over-trusting occluded segments. If a hand disappears behind the torso or a knee leaves the frame, a graph can still appear continuous. That continuity may come from estimation and smoothing, not true visual evidence.
Why this belongs in a biomechanics course
Computer vision gives instructors a way to teach measurement literacy. Students learn that every signal has a source, every model has assumptions, and every conclusion needs evidence. That is a better learning outcome than simply memorizing definitions of kinematics and kinetics.